 Versión Español


EspañolA couple walks along the streets of Buenos Aires. They see a person sleeping on a sidewalk with some blankets that the kind people of the neighborhood have provided. They lament the sad situation and begin a dialogue on the subject of poverty.
But why did they start talking about the topic? That is, how did they perceive that the person who slept on the sidewalk was poor? The question may seem trivial and the answer too obvious.


The homeless man’s poverty is because of a lack of material goods.
The poor are poor because they do not reach a minimum threshold of material possessions. We measure one person’s level of poverty in relationship to another by the amount of goods and services available to them.
The couple discusses this until they arrive home. There they have a roof over their heads, food on the table and clothing in abundance. The difference between wealth and poverty is clear in this case. The more goods and services available to an individual, the richer they will be.
In the case of countries, the situation is similar. The more goods and services available to its inhabitants, the better the living condition and the lower the level of poverty. It is for this reason that the indicator par excellence of the wealth of a nation is the GDP per capita. GDP per capita is essentially the division between the total of goods and services produced by an economy and the total of its population. The indicator seeks to yield an average measure of the prosperity of individuals in each country.
With this analysis in mind, it should be enough to understand how important economic growth is for a population to prosper. If the economy grows more, more goods and services are produced and, therefore, the quality of life of a country improves. However, this approach does not satisfy everyone.
GDP per capita is often criticized for not measuring inequalities or income distribution. If John has two chickens, while Peter does not have any, the GDP per capita of that small country will be a chicken, hiding the reality that Peter has nothing.
From this point of view, what the government must do to address poverty is tax the rich (John) to subsidize the poor (Peter). Only then can John and Peter have better-distributed wealth and end Peter’s poverty.

If the state charged John 50 percent in taxes to subsidize Peter, the GDP per capita would actually reflect the situation (one chicken per person) and neither would be poor. However, in more complex economies, and considering dynamic factors, the example is no longer useful.
Because, if the government punishes wealth, then the incentive to create it will fall and then everyone will be poorer.
We must find a system in which wealth creation is not punished, and improves everyone’s situation.
There’s good news: that system already exists.
According to the data prepared and disseminated by Oxford University’s site Our World in Data, there is an inverse relationship between GDP per capita and the number of people who are poor. That is, the larger the size of the economy, the lower the poverty.
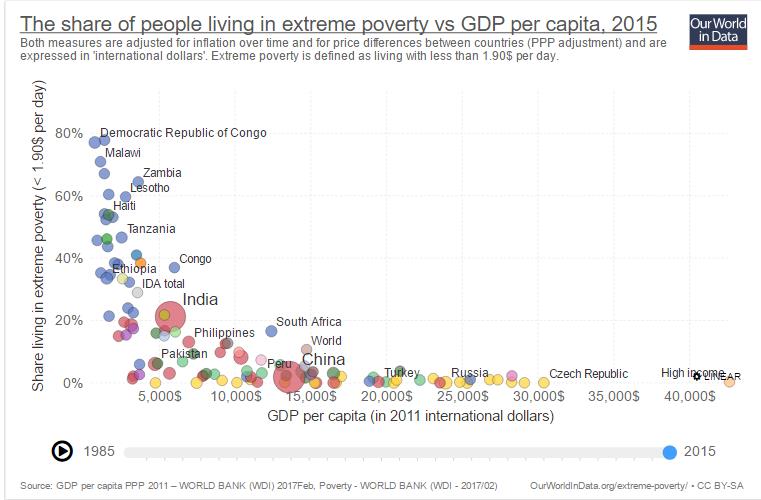
According to the World Bank, the publication finds that a person is in “extreme poverty” if they earn less than USD $1.9 per day. In addition, it concludes that:
“There is no country with a GDP per capita above US $15,000 (international) where more than 5 percent of the population lives in extreme poverty. In addition, in most countries with a GDP per capita of less than US $4,000, between 25 percent and 75 percent of the population lives in extreme poverty. ”
Our World in Data, a specialist in economic data, also cites the 2002 Dollar and Kraay study, which concludes that “on average, growth benefits the poor as much as the rest of society.” The average increase in per capita income generally translates into a rise in the incomes of the poorest groups in society.
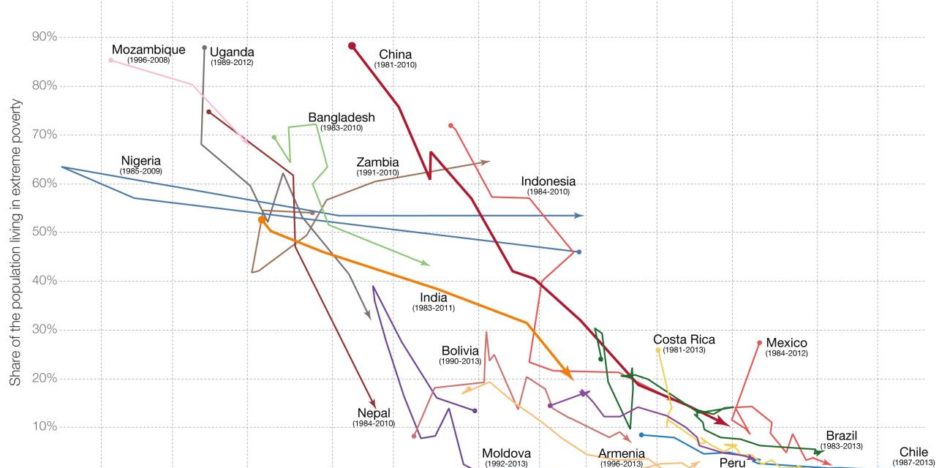
Additionally, extreme poverty evolves in each country as the average per capita GDP rises:
The GDP per capita is on the horizontal axis. As we move to the right, the wealth of the country increases. The vertical axis reflects the percentage of the population living in extreme poverty (i.e, charging US $1.9 per day). As we move downward, the lower percentage of the population lives in extreme poverty.
The chart shows how in countries like India, China, Indonesia and Brazil, among others, the relationship between growth and lower poverty is a direct one.
Government assistance and redistributive policies can be considered transitional measures to alleviating situations of need. However, to overcome poverty definitively, you also need economic growth.
Greater growth is more wealth for all.


